


This post has been reposted from the CompassRed blog
Recently, a client tasked CompassRed with creating a social listening report to compare their Facebook and Twitter engagement to their competitors. Since a lot of the client’s reporting already exists in Google Data Studio for other digital analytics initiatives, we knew this would be the right tool with the least friction. Adapted for the higher education vertical, we’re sharing this report!
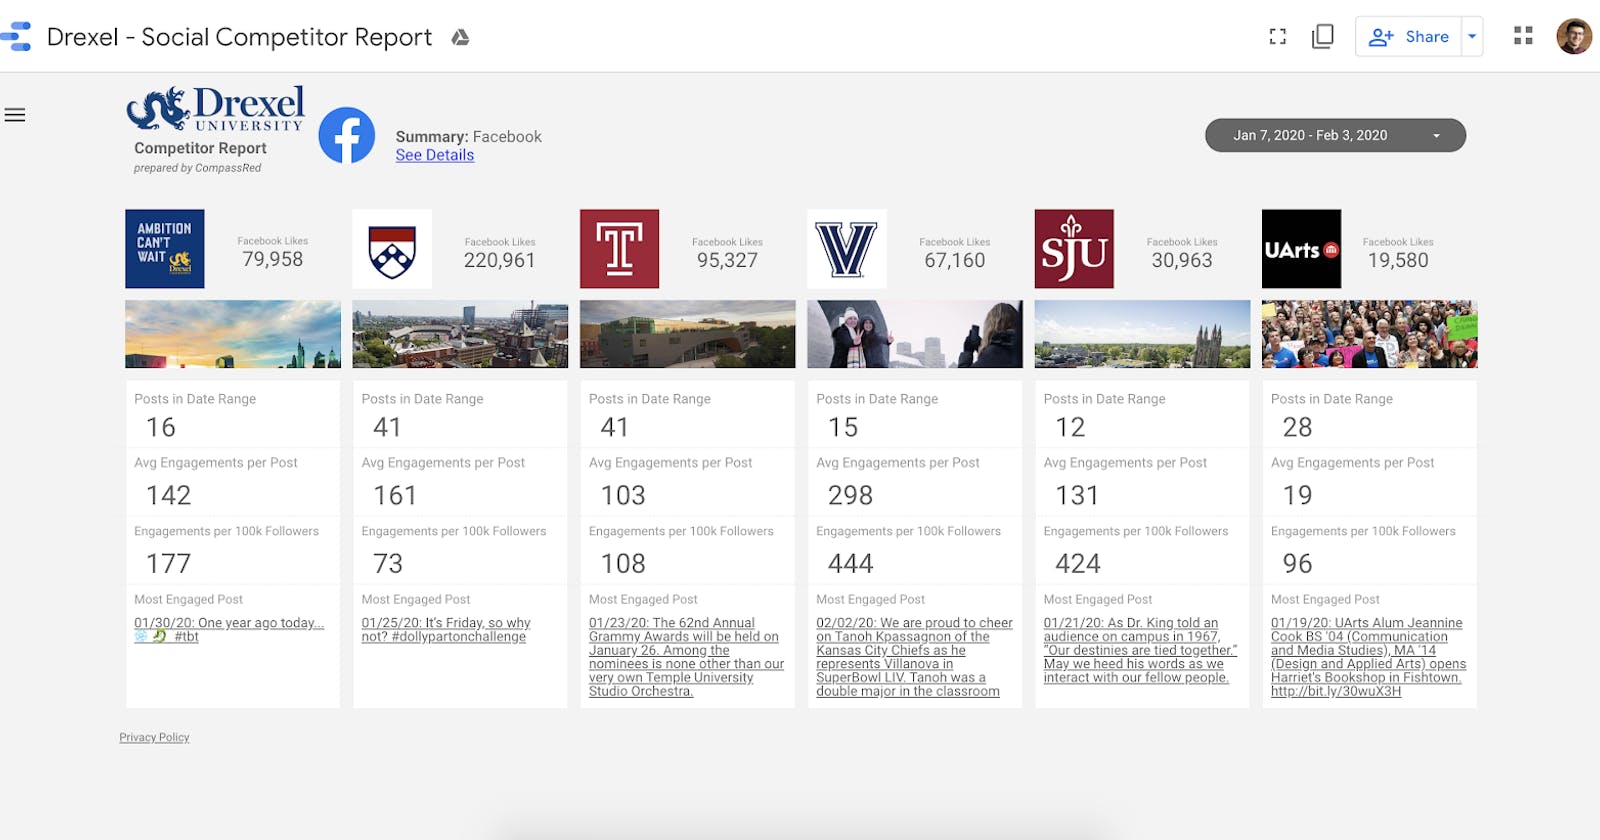
As you can see in the view above, we’ve compared Drexel University’s Facebook activity to its “competitors” (or other schools in the Philadelphia area). The Engagements metric consists of a number of total reactions (like 👍, heart ❤️, haha 😆, wow 😮, sad 😢, angry 😡), number of shares (sharing a post to a user’s own network), and number of comments.
Average Engagements per Post is a good metric for an individual account, but it becomes less ideal when comparing to other accounts with very different scales of followers. This is where the Engagements per 100k Followers metric comes in. If we calculate the difference in followers to a constant (ie: 100,000 followers) we can normalize engagement. The Data Studio calculated field formula is below:
= ROUND((Engagements / (Account Likes / 100000) / Post Count),0)
In the Facebook Details, we get a deeper breakdown of the top posts by engagement. Here we can go into more detail per post, providing the image, text (linked to the post itself), the metrics making up engagement, and our normalized engagements metric.
As a design principle, we find this “card” format allows for a modular system. If a client has an additional report component they want to add, this becomes less of a lift if the layout is flexible. Additionally, incorporating the profile image and cover brings more of the “brand” experience to the report.
The Data Studio connectors behind the scenes are Supermetrics’ Facebook Public Data and Twitter Public Data. To decrease report load time, we’ve selected only the fields required for the components included in a Data Extract and scheduled a daily refresh for the trailing 60 days. From there, a data blend is required for the two types of Facebook data queries (Facebook page data and Facebook post data) in order to create that normalized metric.