


This post has been reposted from the CompassRed blog
For this week’s Makeover Monday data visualization exercise, I downloaded tweets from the increasingly popular Emoji Mashup Bot. This Twitter bot takes two emojis and creates a mashup between the two every hour. The author, Louan Bengmah, uses the Processing programming language to extract features from each emoji and combine them to create emoji “mashups”.
My original hypothesis for this exercise was that the most favorited mashups are the ones that combine happy and sad emojis. After doing some research on emoji sentiment, I discovered the 2015 study Sentiment of Emojis and its emoji sentiment table. The authors (Petra Kralj Novak, Jasmina Smailovi´c, Borut Sluban, and Igor Mozetiˇc) downloaded 1.4 million European language tweets (4% of which contained emojis), used existing sentiment lexicons to calculate tweet text sentiment, attributed that text sentiment to the emojis featured in the tweet, and created sentiment scores for each emoji.
By combining the emoji sentiment score from this study with the “source” emojis for each mashup, we can start visualizing each mashup in a new way.
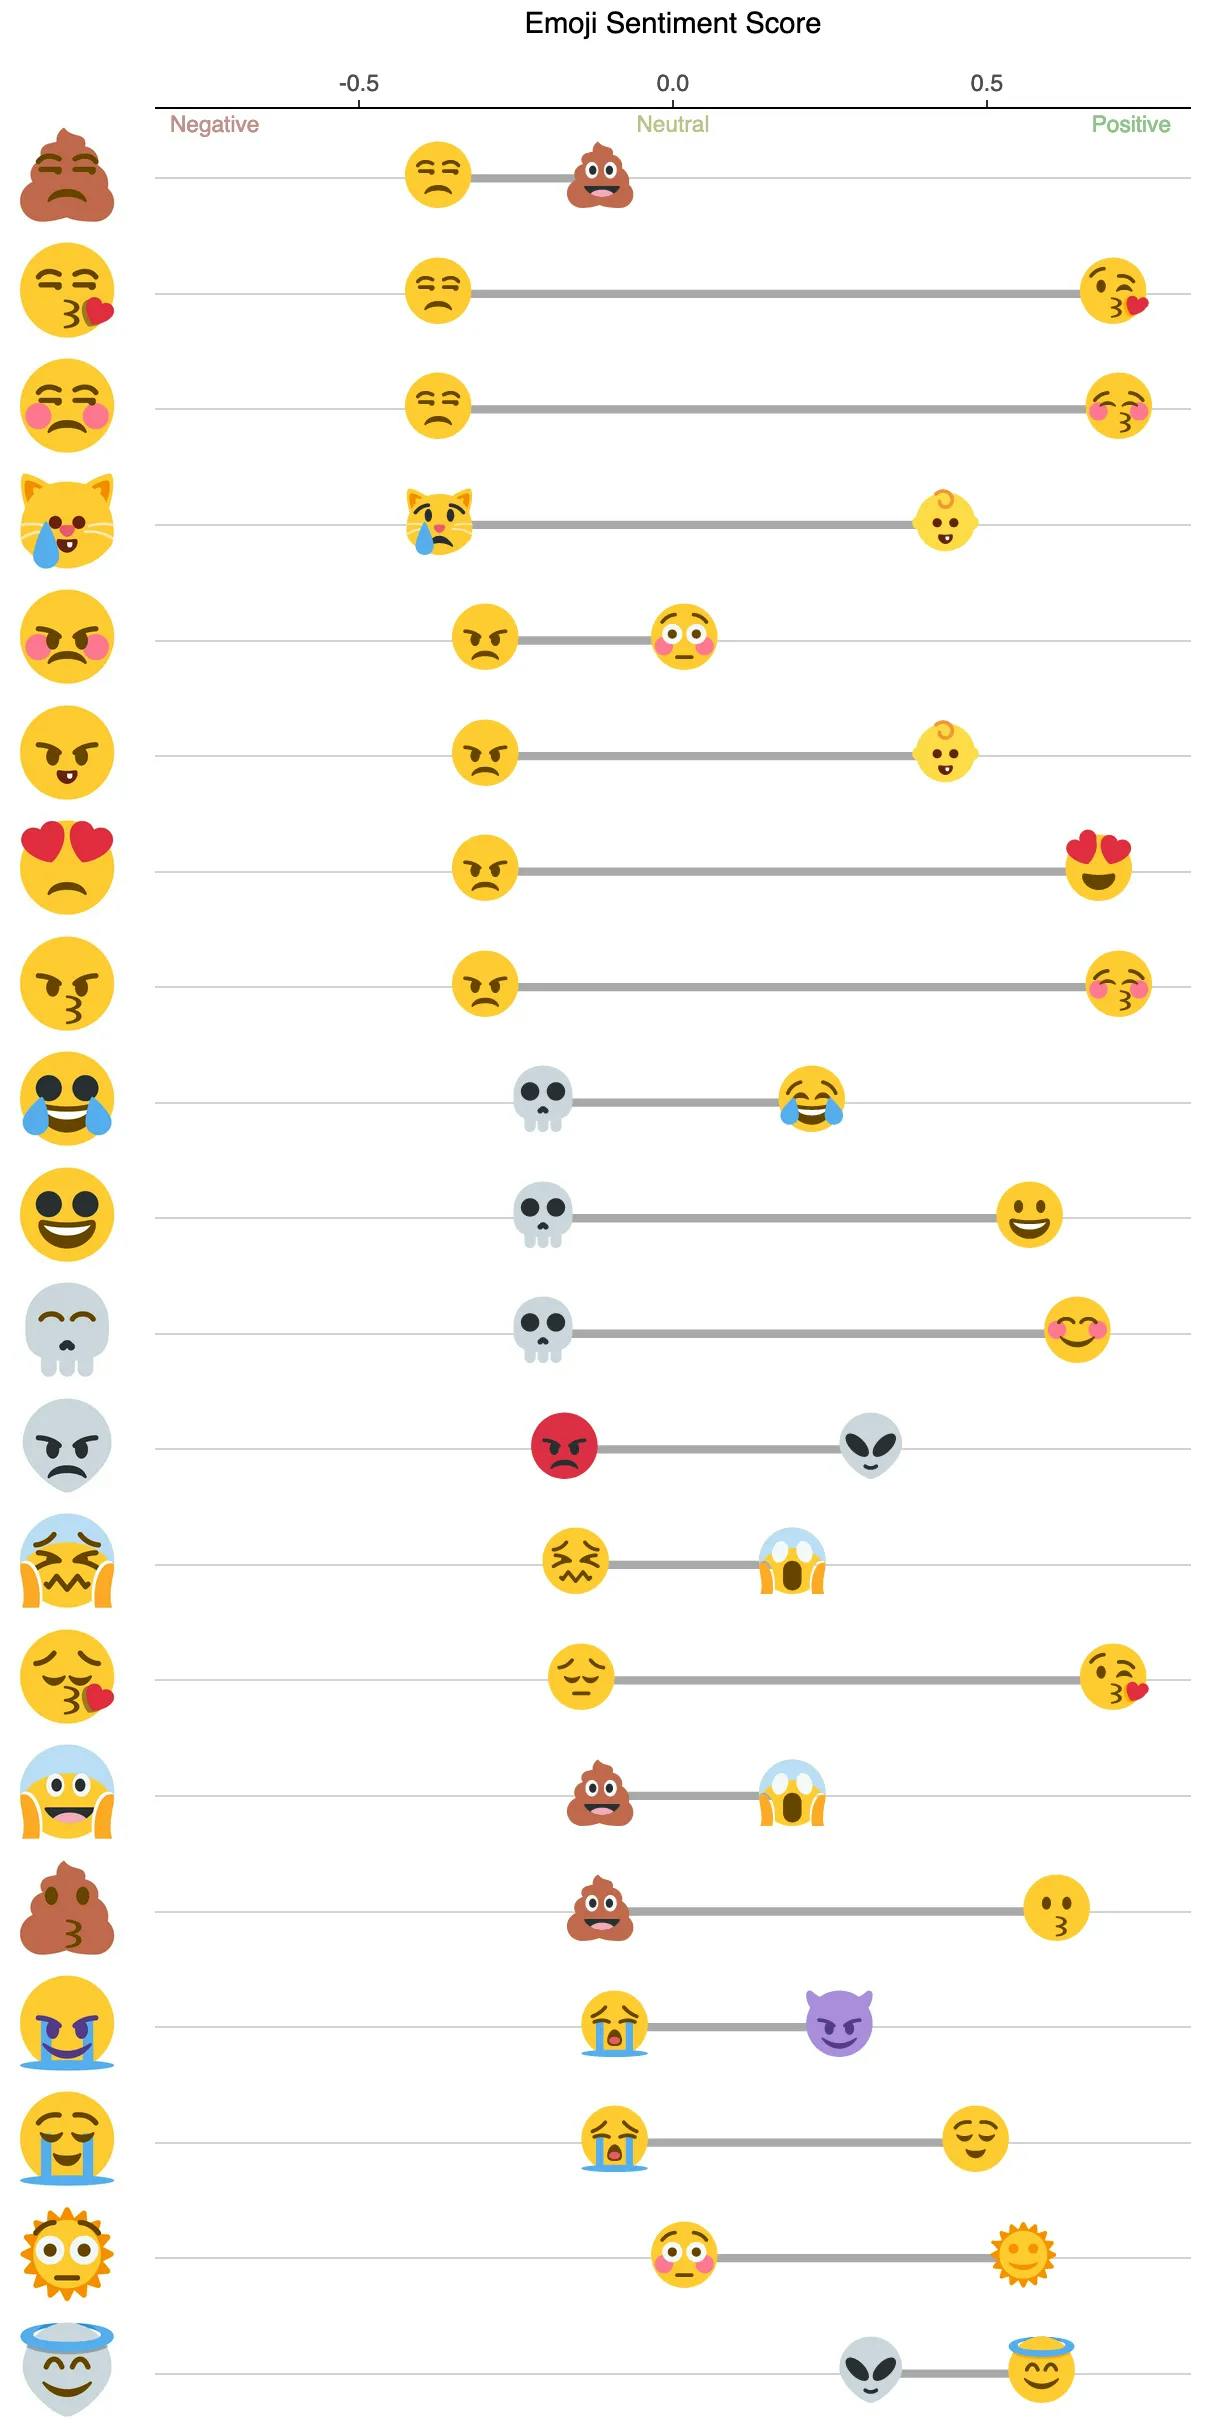
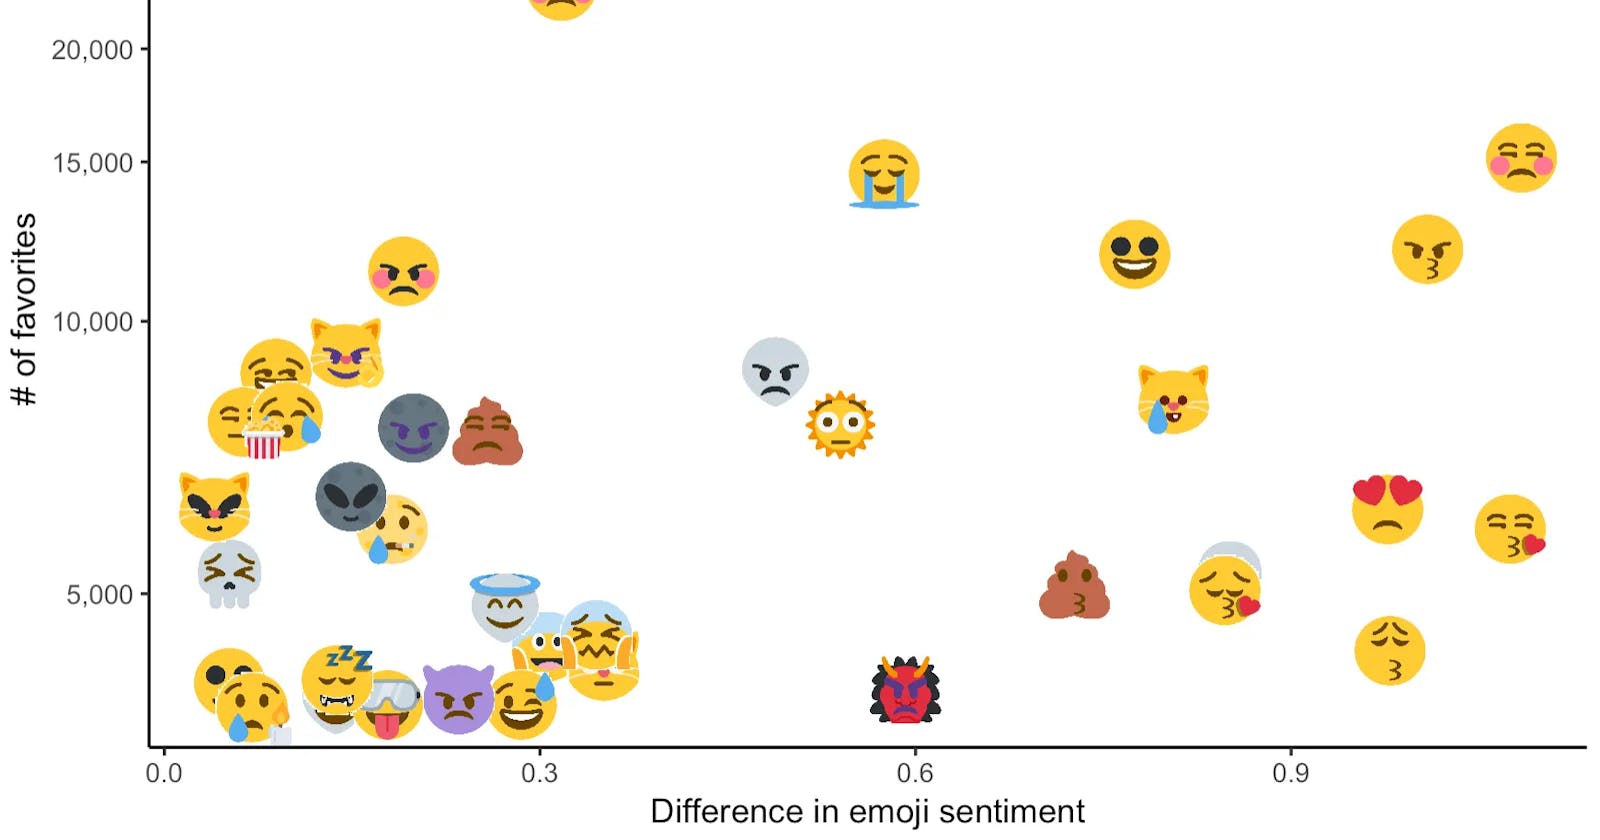
The above exploratory visual helps us understand some differences in sentiment score that make up a sample of the most popular mashups. To take this a step further toward analysis, let’s plot the difference in sentiment score by number of favorites using a slightly larger sample of the most popular mashups.
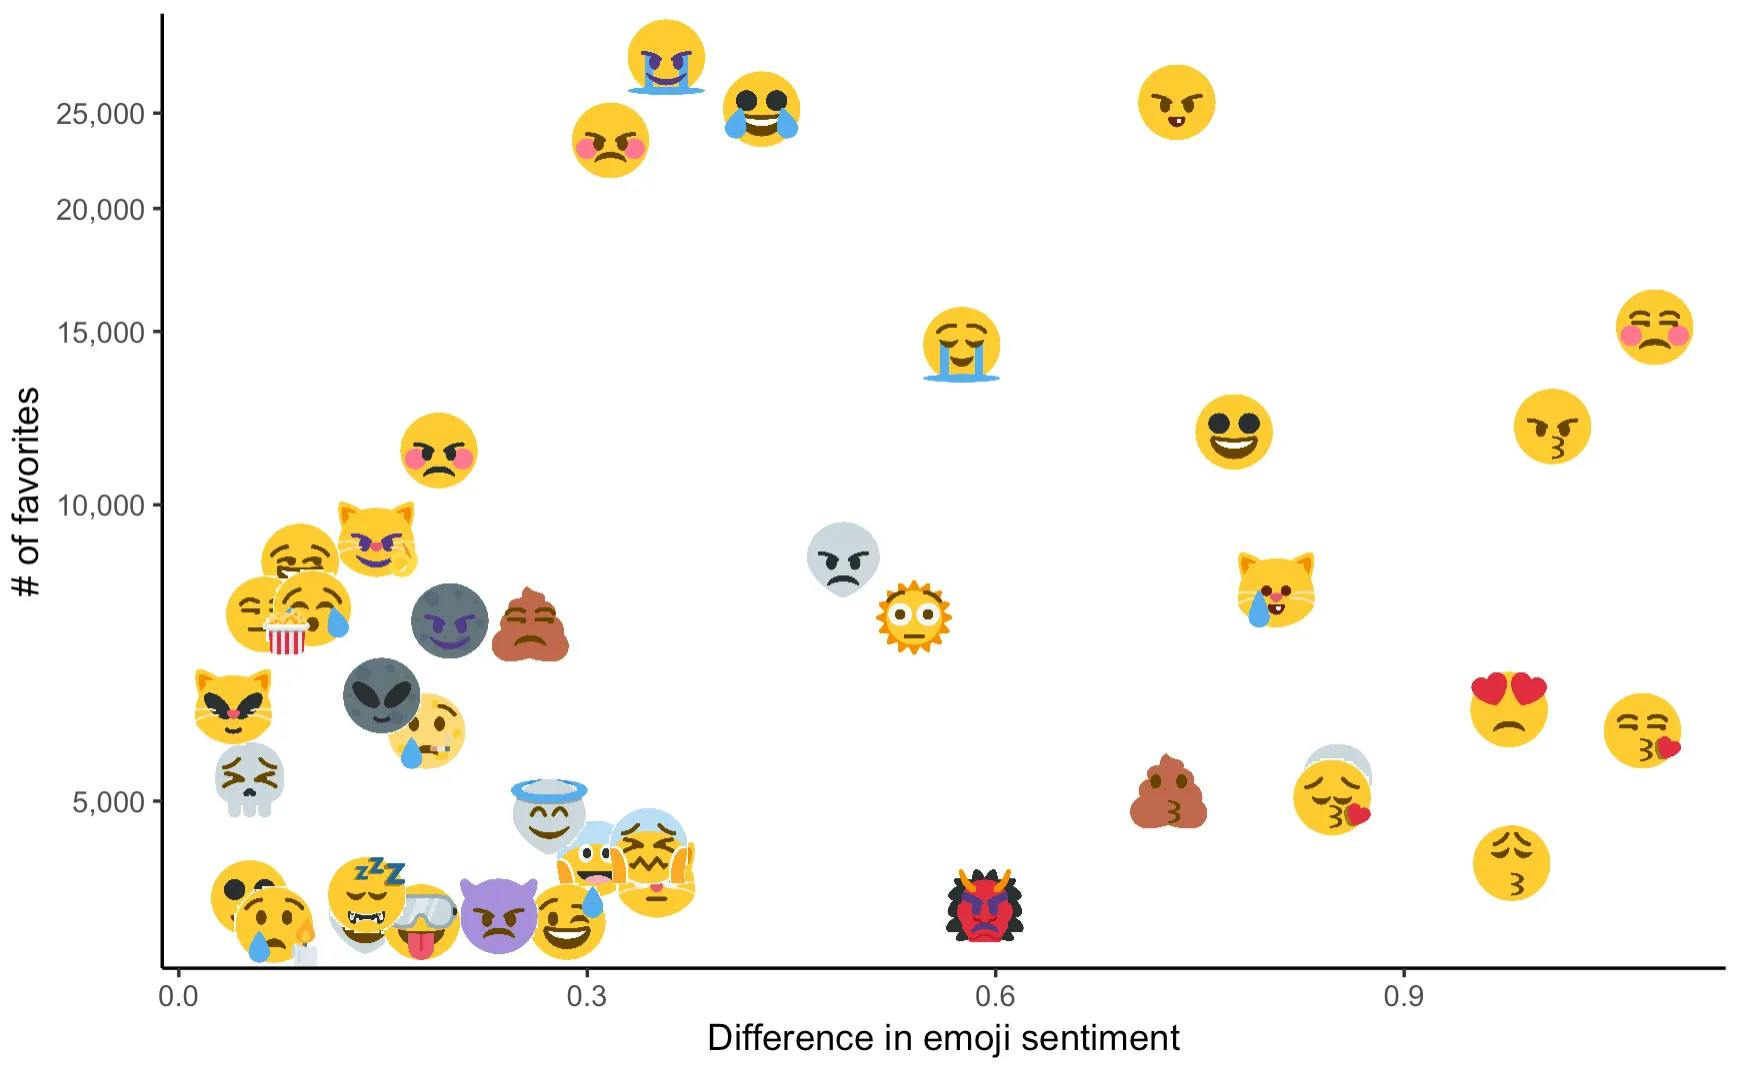
Although the difference in source emoji sentiment score does not seem to have a strong correlation with favorites, I’ve enjoyed using one of my favorite Twitter accounts as a data source for visualization!
Notes
All data cleaning and visualization completed in R
Tweets downloaded using the twitteR package
Data cleaned using the
dplyr(tidyverse) packageVisualizations created using
ggplot2,plotly, and themagickpackagesRead more about how the Emoji Mashup Twitter Bot works here
Twemoji font library found here
Tweets filtered to include emojis found in the Sentiment of Emojis study