


This post has been reposted from the CompassRed blog
You can easily increase the business value of your existing data by gathering and joining publicly available information from the web. Let’s walk through two web scraping examples through the lens of a Disney World competitor compiling a competitive dataset and then talk about some other data sources.
Data from Wikipedia Tables
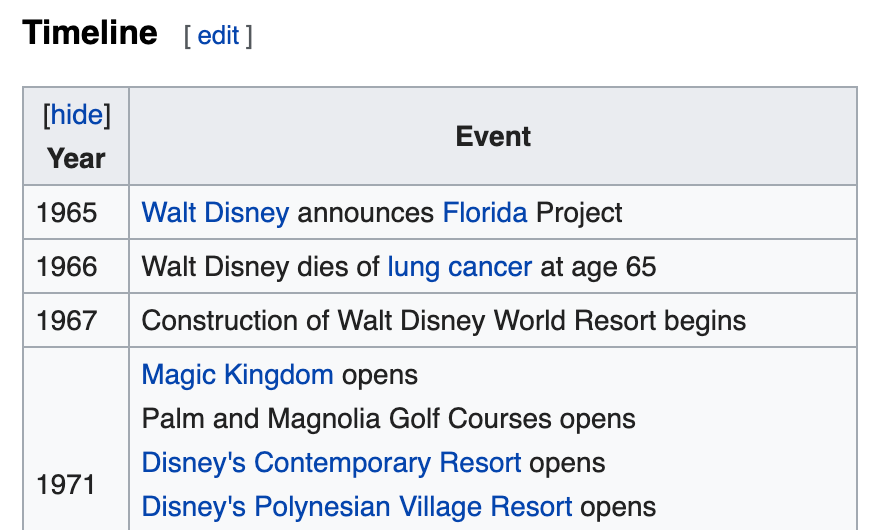
Wikipedia has a lot of rich information from contributors. Many tables can be extracted with a few lines of code. We’re using R to scrape this Disney World event timeline table; the rvest package for web scraping/HTML parsing and dplyr package for data cleaning. This post assumes you have basic HTML structure knowledge, but it’s important to take a look at the DOM and understand how you’re going to access the data you want (in this case, we’re accessing the first <table> element with class wikitable).
#call the rvest and tidyverse libraries
library(rvest)
library(tidyverse)
#read in html from page
wdw_wiki_html <- read_html("https://en.wikipedia.org/wiki/Walt_Disney_World")
#select and convert html table to data frame
wdw_event_timeline <- wdw_wiki_html %>%
 #select first table with class "wikitable"
 html_node("table.wikitable") %>%
 #convert html node to character string
 as.character() %>%
 #replace all break tags with new lines for formatting
 str_replace_all("<br>", "\n") %>%
 #read back into html
 read_html() %>%
 #parse html table into data frame
 html_table() %>%
 #get first result in list
 .[[1]]
#convert column names to lowercase
names(wdw_event_timeline) <- names(wdw_event_timeline) %>% tolower()
If all goes well, you’ll end up with a neat data frame! Here’s a preview:
year
1 1965
2 1966
3 1967
4 1971
5 1972

event                                                                                                                                                                                                            event
1 Walt Disney announces Florida Project
2 Walt Disney dies of lung cancer at age 65
3 Construction of Walt Disney World Resort begins
4 Magic Kingdom opens\nPalm and Magnolia Golf Courses opens\nDisney's Contemporary Resort opens\nDisney's Polynesian Village Resort opens\nDisney's Fort Wilderness Resort & Campground opens\nRoy O. Disney dies at age 78
5 Disney's Village Resort opens
Data from Article Text
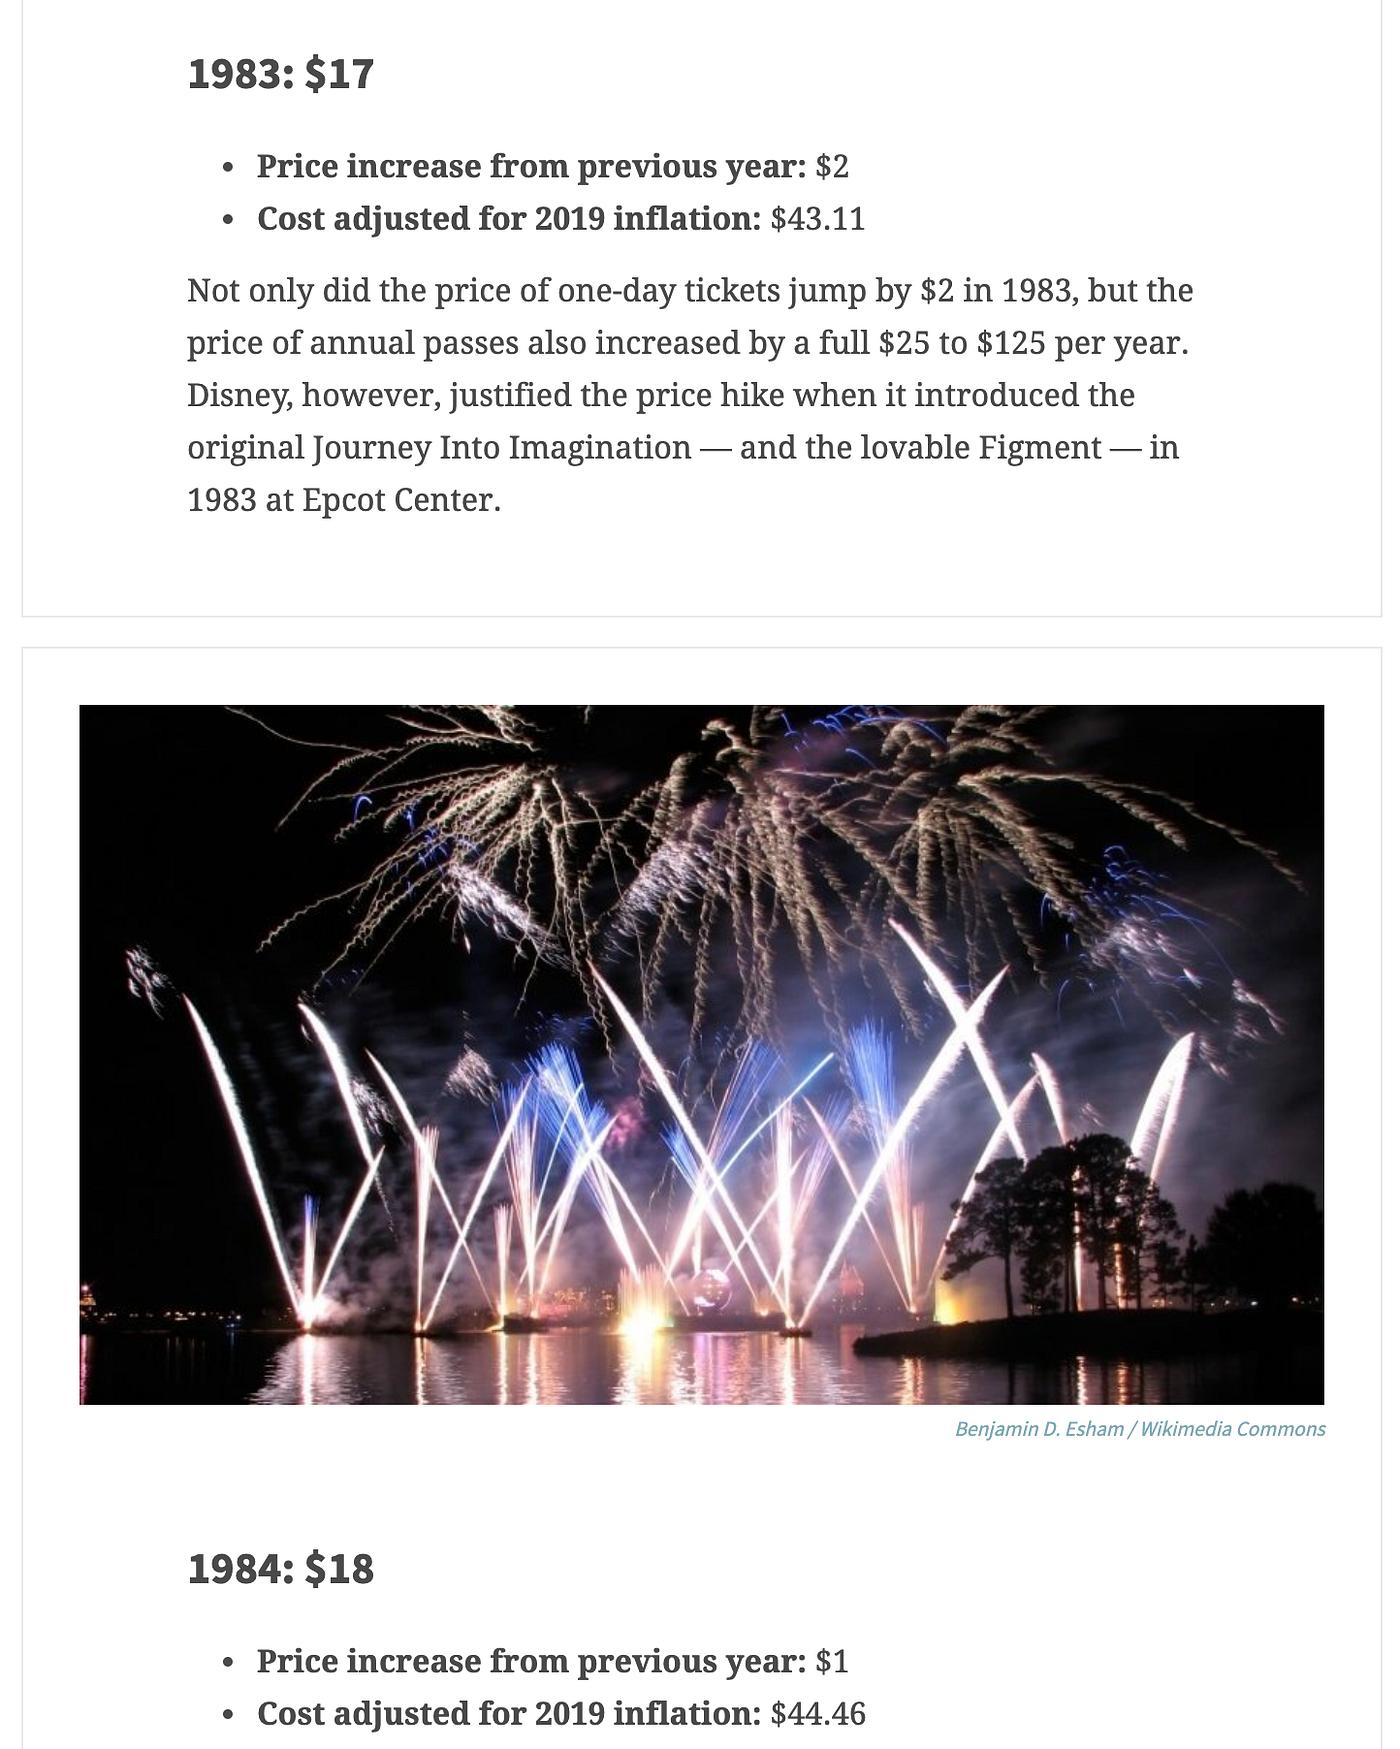
In many cases, the data you’re interested in collecting won’t be in a nice table format. You’ll have to parse HTML more creatively to wrangle the data. In this example, we’ll be extracting historical Disney World ticket pricing from an article that provides data as text in different HTML elements. Again using rvest and dplyr, we’ll create a data frame of year, historical price, and adjusted price, ready to be joined to the Disney World event timeline. The year and historical prices (bolded text below) are all <h2> elements on the page and the adjusted price can be found in <li> elements. These will be explicitly extracted through an XPath expression.
#read in html from page
wdw_prices_article_html <- read_html("https://www.gobankingrates.com/saving-money/entertainment/how-much-disney-world-cost-year-born/")
#format historical prices
wdw_prices_historical <- wdw_prices_article_html %>%
  #get all h2 elements
  html_nodes("h2") %>%
  #convert to list of character values (ie: "1983: $17")
  html_text() %>%
  #convert to data frame
  data.frame(year = .) %>%
  #separate the year and price into two columns based on the colon and space
  separate(year,c("year","historical_price"),sep=": ") %>%
  #remove dollar sign
  mutate(historical_price = str_replace(historical_price,"\\$", "")) %>%
  #convert both columns to numeric
  mutate_all(as.numeric) %>%
  #filter NA rows
  filter(!is.na(year))
#format adjusted prices
wdw_prices_adjusted <- wdw_prices_article_html %>%
  #extract all li elements containing the relevant text
  html_nodes(xpath = "//li[strong[contains(text(),'Cost adjusted for 2019 inflation:')]]") %>%
  #convert to list of character values
  html_text() %>%
  #convert to data frame
  data.frame(adjusted_price = .) %>%
  #remove preceding text
  mutate(adjusted_price = str_replace(adjusted_price,"Cost adjusted for 2019 inflation\\:", ""))  %>%
  #remove whitespace
  mutate(adjusted_price = str_replace(adjusted_price,"\u00A0", ""))  %>%
  #remove dollar sign
  mutate(adjusted_price = str_replace(adjusted_price,"\\$", ""))  %>%
  #convert column to numeric
  mutate(adjusted_price = as.numeric(adjusted_price))
#combine two pricing data frames
wdw_prices_combined <- wdw_prices_historical %>%
  #add wdw_prices_adjusted as a column
  cbind(wdw_prices_adjusted) %>%
  #if 2019, use "historical" price as adjusted
  mutate(adjusted_price = ifelse(year == 2019,historical_price,adjusted_price))
If all goes well, you’ll end up with another neat data frame ready to be joined to the event timeline data frame. Here’s a preview:
year   historical_price   adjusted_price
1971               3.50            21.92
1972               3.75            23.26
1973               4.50            26.44
1974               5.25            27.44
1975               6.00            27.99
Combining the Data
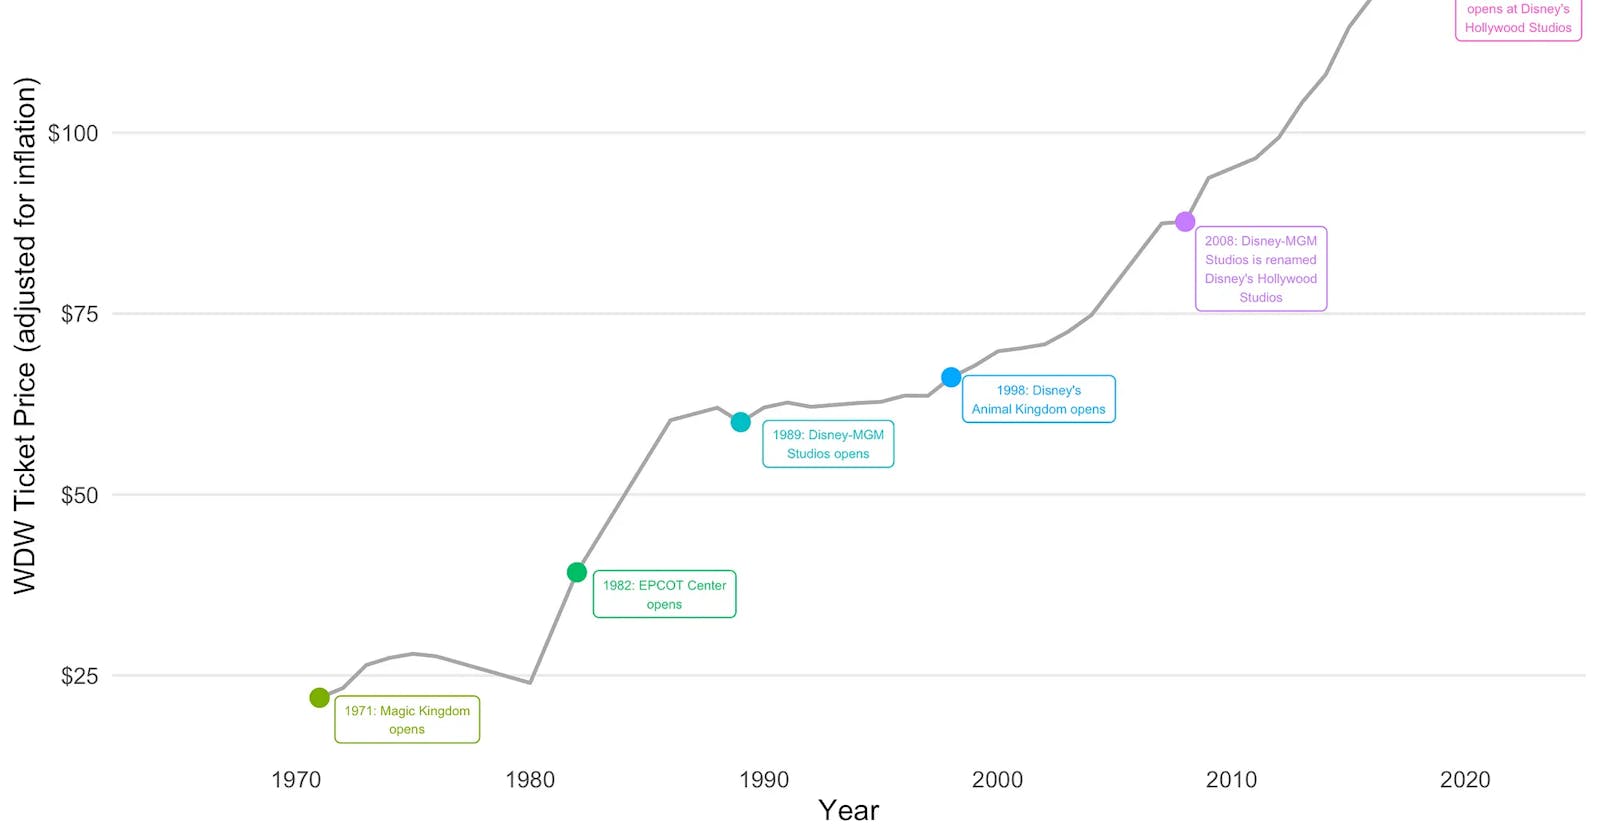
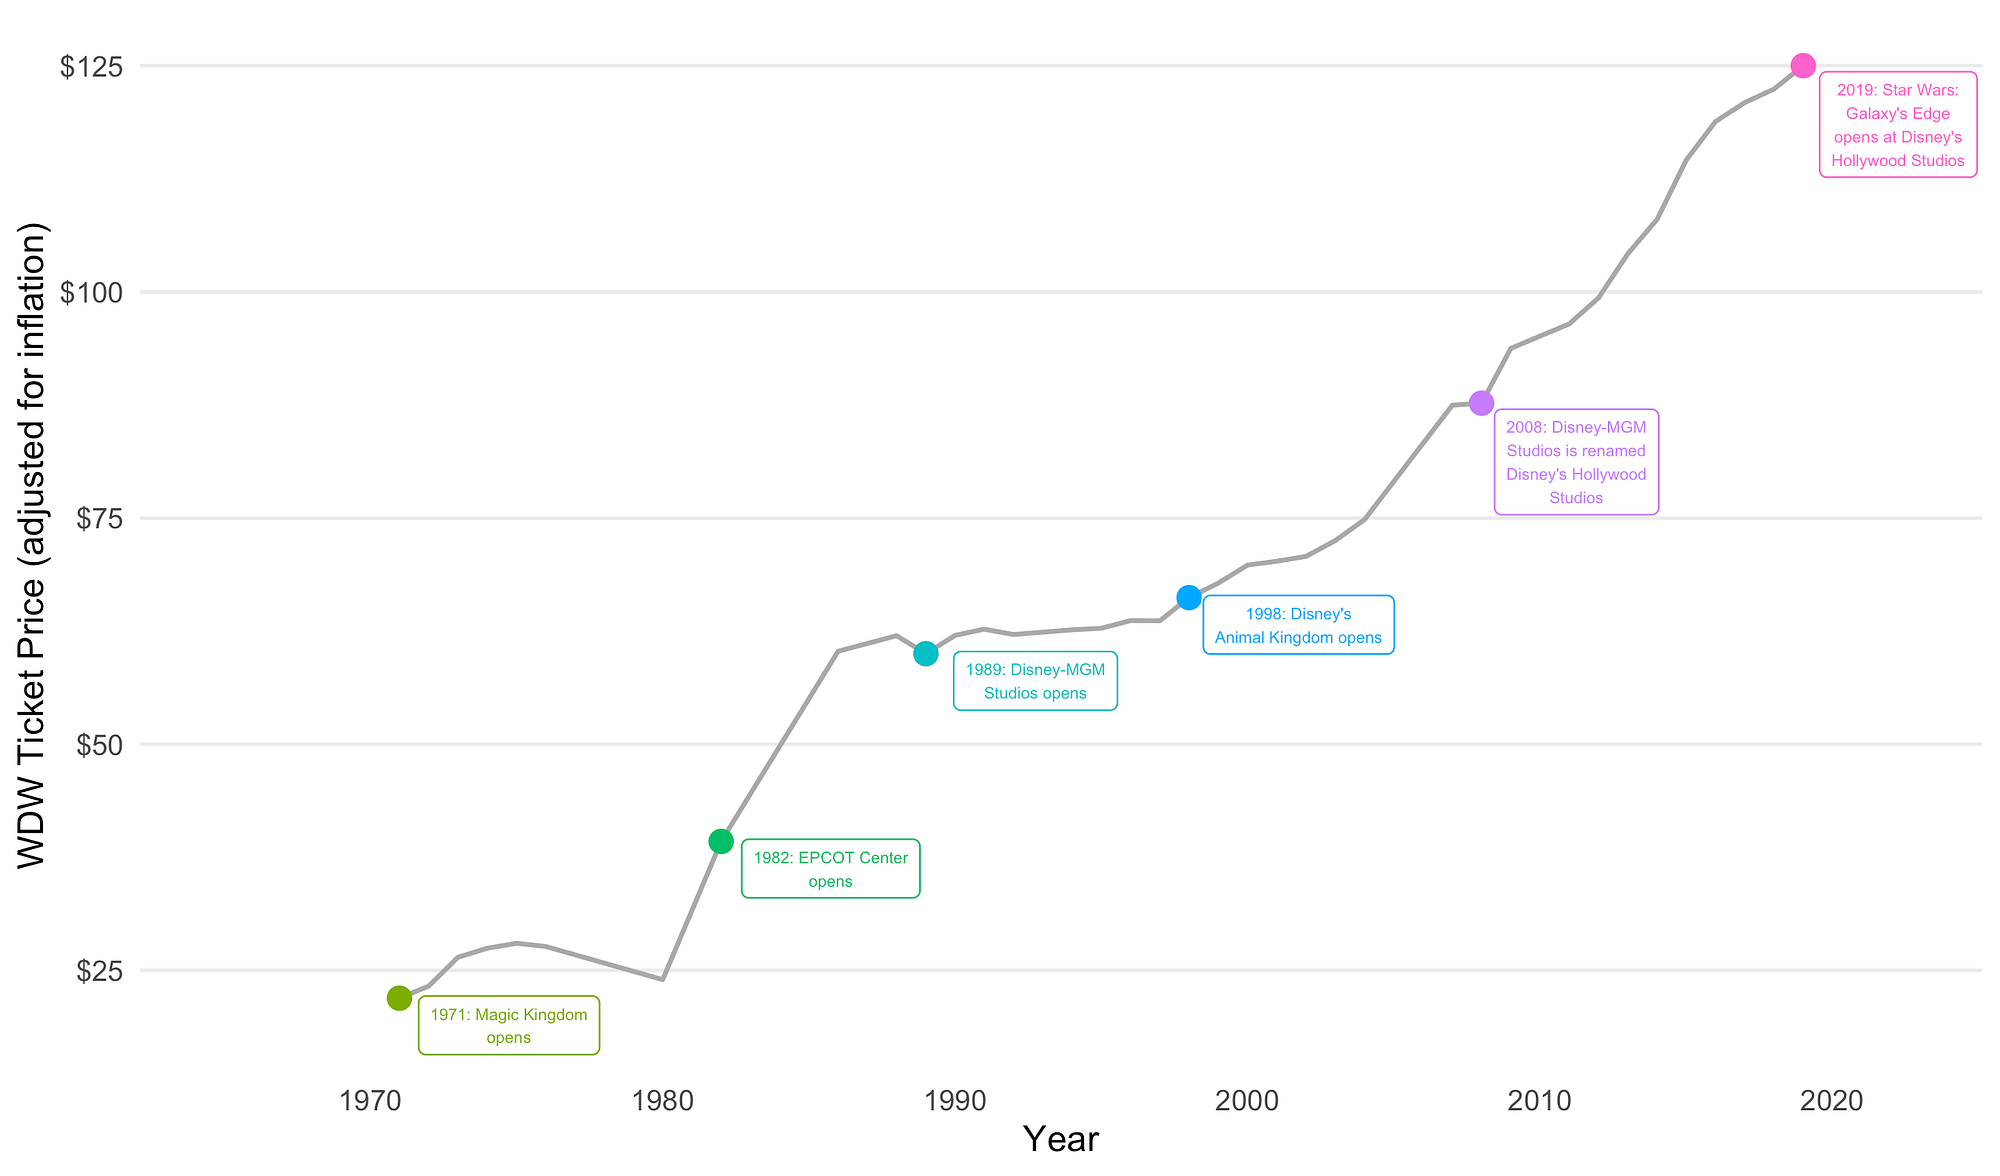
Bringing these two datasets together could look something like the below visualization (code can be found here). Think about the output you have in mind before starting to gather data. Are you creating another table in your internal database? Are you collecting this information for reporting/sharing? What does the deliverable look like?
Data from JavaScript Intensive Websites
In some cases the data you want to collect will be inaccessible through a headless browser where there is no GUI or graphical user interface. Some sites require JavaScript to load in order to display information so a tool like the rvest package won’t suffice. One example of a non-headless browser automation tool is Selenium. Although meant for testing web applications, this tool can open a browser window and execute commands programmatically. This kind of web scraping requires its own post, but you can learn more about Selenium here and take a look at the Python library documentation here.
Other Data Sources to Consider
Depending on the domain, chances are high that there is an existing dataset out there that will meet your needs (or better yet, an API for the data you need). Here are a few examples of R packages that might prove useful in a similar project.
Google Trends: gtrendsR
Search volume trend for “Walt Disney World Resort” topic on Google Trends
#call the gtrendsR package
library(gtrendsR)
#download trend data for the “Walt Disney World Resort” topic (%2Fm%2F09b1k) in the United States, for all time (back to 2004), and only download interest trend data
wdw_gtrends <- gtrends("%2Fm%2F09b1k","US",time = "all",onlyInterest = T)
wdw_gtrends <- wdw_gtrends$interest_over_time
#preview data
wdw_gtrends %>%
  select(date,hits) %>%
  head(5)
      date hits
2004-01-01   67
2004-02-01   61
2004-03-01   60
2004-04-01   52
2004-05-01   51
NYSE: quantmod
Stock prices for Walt Disney Co (DIS)
#call the quantmod package
library(quantmod)
#define stock symbol (DIS) and data source (Yahoo Finance)
getSymbols("DIS",src = "yahoo")
#extract data to data frame and convert row names (date) to column
DIS <- as.data.frame(DIS) %>%
  rownames_to_column("date")
#preview
DIS %>%
  select(date,DIS.Close) %>%
  head(5)
      date DIS.Close
2007-01-03  33.73830
2007-01-04  34.00465
2007-01-05  33.72844
2007-01-08  34.03425
2007-01-09  33.98492
Tweets: rtweet
Twitter timeline for @WaltDisneyWorld
#call the rtweet package
library(rtweet)
#define API token credentials (see this guide on Twitter API authentication)
create_token(
  app = "app",
  consumer_key = "consumer_key",
  consumer_secret = "consumer_secret",
  access_token = "access_token",
  access_secret = "access_secret")
#define handle and get max tweets allowed in call
wdw_twitter_timeline <- get_timeline('WaltDisneyWorld',n = 3200)
#preview
wdw_twitter_timeline %>%
  select(created_at,text) %>%
  head(5)

created_at          text
2019-09-13 13:52:38 Check out the latest color …
2019-09-09 17:10:40 VIDEO: Six-year-old Jermain…
2019-09-06 15:21:18 Ready to live your own Star…
2019-09-03 20:13:52 Based on the most recent we…
2019-09-02 21:18:32 Based on the most recent fo…
Thinking Outside the Box
Web scraping and gathering data from around the web can be taken much further to enhance the value of your business. Any attribute of or interaction with a web page can be transformed into a dataset; image gathering for image recognition algorithm creation, competitive SEO (search engine optimization) research, text scraping/mining for sentiment analysis. The possibilities are endless. What other applications do you think this kind of information gathering has? Leave a comment below!